Please note that this text is not investment advice. All the information contained in it are my subjective thoughts on the cryptocurrency market.
First of all, I’d like to thank you for purchasing this e-book!
If you are not yet familiar with the free Bitcoin Compendium – Part 1, I strongly encourage you to read it first: https://learncryptocenter.com/en/knowhow/.
Without further ado, let’s get started!
Table of Contents
Cryptocurrency market manipulations
Recently, we have witnessed manipulations that have led to unprecedented drops in prices. At such moments, no rules of the game apply to the market.
Elon Musk and Tesla
As you probably know, Tesla bought Bitcoins for around $1.5 billion. Additionally, it has announced that they will be accepting payments in BTC for the cars they sell.
Not only that… Elon Musk has said that the Bitcoins they will receive as payment for the cars they have no intention of selling.
However, at one point, Elon Musk announced on his Twitter account that Tesla stopped accepting payments in BTC. The argument behind it was concern for the environment.
Namely, Elon Musk believes that Bitcoin transactions generate too much CO2 into the atmosphere by consuming electricity from coal-fired power plants.
Let’s take a closer look at it
In practice, Bitcoin uses the same amount of power regardless of the number of transactions.
If all the people in the world stop sending BTC, Bitcoin will use as much electricity as it would when hundreds of thousands of transactions were sent.
In this article, you will learn more about how it works.
Electricity is used by miners to secure the network, not to carry out transactions. In turn, the source of electricity for the largest mines in the world is 75% renewable energy.
Moreover, everything indicates that in a few years’ time it is going to be almost 100%.
Does Elon Musk know this?
Let’s consider whether a person who has invested his company’s annual profit in Bitcoin does not know how Bitcoin works?
Can a person who is an engineer himself and who surrounds himself with world-class engineers really not know this?
It would all be obviously understandable if Elon Musk had sold all Bitcoins on behalf of Tesla in advance.
But he didn’t…

The very fact that a person who wants to colonize Mars does not know how Bitcoin works gives food for thought.
However, even stranger is that knowing how the market will react (i.e., the price drop), he provided negative information about BTC, while owning Bitcoins worth $1.5 billion.
What could this mean?
Considering the above facts, it is very likely that one of his companies or he himself was interested in buying a huge amount of BTC.
However, the stock exchanges lacked liquidity.
What is liquidity?
There is only a limited amount of Bitcoins available for purchase on exchanges.
If you wanted to do a transaction for $1 billion, it would quickly turn out that even if you buy all the Bitcoins that are available for sale on a given exchange, you are not able to spend the entire amount.
There is simply no such large amount of BTC on cryptocurrency exchanges.
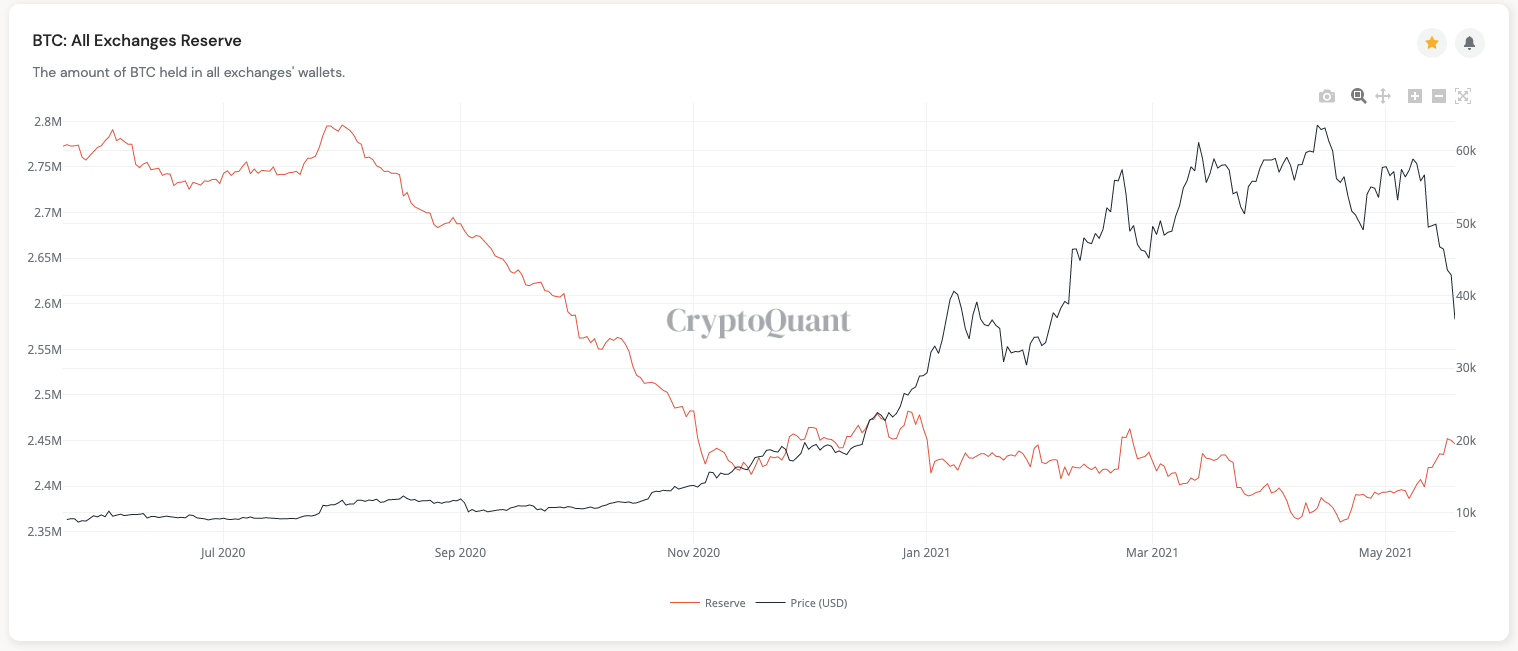
This chart shows how much BTC is currently on all exchanges.
You will find it on the website: https://cryptoquant.com/overview/full/247?window=day.
As you can see, the amount of Bitcoin on exchanges has been declining regularly recently.
Thus, the liquidity decreased.
However, after recent events, we can see an increase.
This is evidently caused by market manipulations aimed at leading to the so-called “irrational sale.”
Irrational sale means that not only can large corporations and institutions buy their cryptocurrencies much cheaper, but they can buy them at all.
Cryptocurrency ban in China
Another factor that triggered the huge drops is the ban on cryptocurrency transactions by financial institutions in China.
Of course, this caused panic but for some unknown reason.
Trading cryptocurrencies on exchanges in China has been illegal since 2019.
Despite this, the Chinese somehow manage. Simply put, they don’t buy cryptocurrencies on the stock exchange but directly from other people.
This information actually does not change anything
The fact is that it was definitely a planned action.
It was enough to spend millions of dollars spreading such information on the internet and presenting it as if it was something serious.
The result was, of course, huge drops, and for the organizer of the whole action an ideal opportunity to buy.
For large institutions, it is incredibly profitable, despite the huge funds spent on marketing.
If an institution invested $1 billion on the hole in Bitcoin and other cryptocurrencies, after literally an hour they could enjoy a profit of 20–40%.
The same happened in 2017
Please take a look at this article: https://www.businessinsider.com/china-ban-bitcoin-exchanges-2017-9?IR=T.
Take a look at the date of publication in particular.
As you can see, exactly the same action was carried out in 2017. Of course, it was successful a second time running.
Who is selling at such times?
New and inexperienced investors who have just entered this market, obviously.
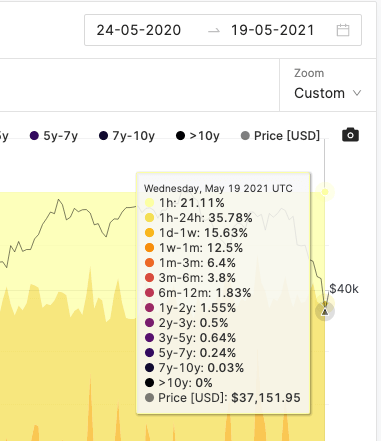
The chart above can be found on the website: https://studio.glassnode.com/metrics?a=BTC&m=indicators.Soab&s=1590199054&u=1621468800&zoom=
It only shows from how old wallets Bitcoins were moved on May 19, 2021, when negative information related to China came out.
If someone sent their Bitcoins to a given address 4 hours ago, and then resent them again to the next place, they would be qualified for 1h–24h.
As you can see, almost 80% of people who sold BTC in panic were people who bought their Bitcoins in the month prior.
Just 10 years ago, investing was regarded as something serious, and many people approached it very carefully. People thought twice before they invested their first dollar on the stock market.
As it turns out, the development of technology has made everyone an investor today. All you have to do is install one application on your smartphone, and after 10 minutes you are an investor.
This makes the market behave a certain way, and people like Elon Musk and other big institutions make most of it.
They know that any negative, however insignificant information, will make young and inexperienced investors sell, which in turn will give “the big boys” an opportunity to buy.
When there is growth, the inexperienced find investing fun. However, as soon as some negative information appears, they sell everything in panic instead of thinking the situation over for a moment. It then turns out that they have lost everything they had because of their irrational decisions.
This should make it clear that the boom will last as long as most of the market is under the control of long-term investors.
This article will show you how to control it.
Technical analysis (TA)
I would like to point out one fact straight away: when there is panic in the market, technical analysis stops working. We can even close the chart and not bother with it.
Nevertheless, TA will be useful at times when the market is dealing with an ordinary, healthy correction not triggered by any information and panic.
As you probably know from the free e-book, technical analysis is mostly useful for traders, not investors.
Because traders rely only on TA to find the perfect time to buy and sell. They have to be very precise about all of this, so their knowledge of TA should be very thorough.
After all, What they read from the chart determines whether they will have any profit on any given day.
Technical analysis by investors
It is completely different for investors. They do not need technical analysis on a daily basis, but it is worth knowing its basics.
Whether we like it or not, we need to know where we are currently on the chart, whether the current price is a peak or whether it could be a low.
As you probably know, my strategy is to gradually take profits from altcoins after meeting one of the two conditions I talked about in the free part of the e-book.
Reminder! I start taking profits when the price of 1 BTC is at the highest level in its history (then I take profits from each altcoin a little), or the price of a given altocin is at the highest level in its history.
Nevertheless, technical analysis, in a sense, can help us determine how much momentum we are growing, and therefore how to quickly realize profits.
On the other hand, TA will help us define the maximum level to which we are able to fall during the correction.
But let’s start from the beginning
Let’s open the BTC/USD chart on the website: https://www.tradingview.com/chart.
It should look like this:

If it looks different, change the presentation type to: “Candles” here:

Then set the interval to “1 day”:

What is it about candles?
I am aware of the fact that many of you know very well how candles work, but I will describe them as briefly as possible for beginner investors.
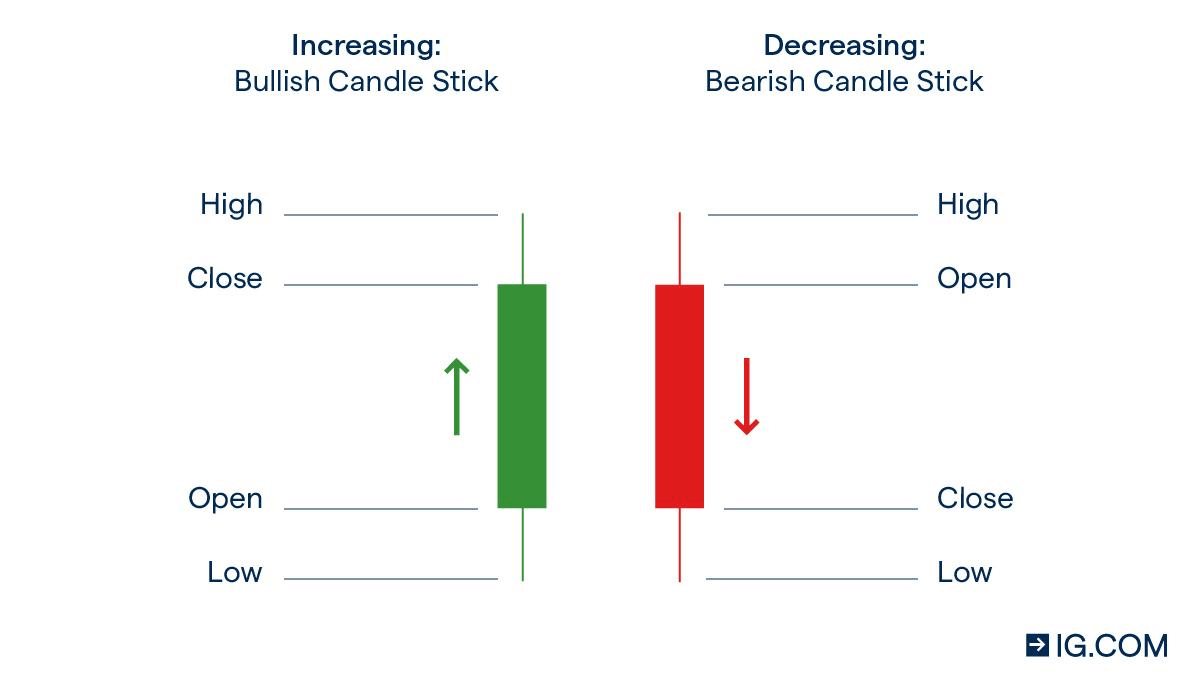
Each candle consists of a body and wicks.
The body is the wide part.
Wicks are those thin lines on both sides of the body.
If you have the interval set to “1 day”—as we set it a moment ago—then one candle corresponds to 1 day.
If you set the interval to 1 hour, then one candle would be equal to 1 hour, and so on.
Every time the set time of 1 day passes, another candle begins to form.
Let’s look at the picture again:
High tells us how much the maximum price was in 1 day. If the price rose during that time and then started to fall, this very thin wick is created to show that the price was there.
Low means the same as High, just from the opposite side of the candle.
Close means the current price if the candle has not finished (before the 1 day is up) or the price at which it closed (because
1 day has passed and another candle is forming).
The green candle indicates that within a given time unit (i.e., 1 day) the price was rising.
The red candle indicates that within a given time unit (i.e., 1 day) the price was falling.
Let’s assume that at 12 midnight the price of 1 BTC was $50,000.
Now it’s 1 second past 12 midnight and another candle has just started.
If the BTC price starts to drop below $50,000, this new candle will turn red.
On the other hand, if the price starts to rise above $50,000 – the candle will turn green.
Open is the price at which a given candle began to form.
With the above knowledge, we now know how to find our way on the chart.
Volume
The volume is the number of transactions that have been carried out in a given time (during the formation of a given candle). The volume is the bars at the bottom of the chart.

If you don’t see them, select: Indicators > (enter the word “volume”) > Select the third item:

The volume is very useful because it lets us learn at what point in the past a lot of people purchased BTC.
For the sake of simplicity, I will use the BTC example, but this also applies to charts of all other assets.
If we find such a point on the chart, the moment the price drops to this level, these people usually will not want to sell their Bitcoins at a loss.
This will help us identify where declines may end in the event of a correction.
How to do it?
Zoom out the graph by holding down CTRL + scroll down.
On a MacBook CMD + scroll down.
Then we look for the moment when we see very high bars on the volume chart.
For me it looks like this:

Then we zoom in on the chart exactly where we see the high volume.
We do this by positioning the cursor at this point in the chart and holding CTRL + scroll up. On Mac, CMD + scroll up.
Then from the menu on the left select “Horizontal Line” as here:

Then we place the cursor at the very bottom of the candle, at which we see a relatively high volume:

Then click to add a line.
Then we do the same on the next high volume candle.
Ultimately, it looks like this:

On the right, in blue, you see two prices that are likely to be lows in corrections.
In this case, it is around $31,999 and $30,255.
If the price starts to drop below $31,999, it is very unlikely that it will stop at the next level of $30,255.
That is why it is worth averaging the price and buying for half on the first level and for the second half on the next level (if it comes to it at all).
As we are in the midst of a decline at the time of writing this, I can show you how the levels we have drawn are being respected:

These are very likely lows and good times for an investment.
Of course, first check the “on chain” data to see if they indicate the end of the bull market.
Additionally, if you see that we are in a correction, the price is going down, but the volume is getting lower, it could also mean that the decrease is slowly ending.
The lower the volume, the fewer people buy/sell the asset.
After all, those who wanted to buy bought, and those who wanted to sell sold. Now the market must decide which way to go.
At this point, there is likely to be a consolidation, that is, indecision in the market:

This is a very good time to make purchases with 50% of the funds we have. If the price starts to rise, we are already in the market and we are making money.
On the other hand, if suddenly the volume starts to increase again and the price goes down, wait for the next volume to “quieten down” at lower levels and make a purchase for another 50%.
It is worth knowing that during a bull market, the correction consists of 3 waves:
A > B >C
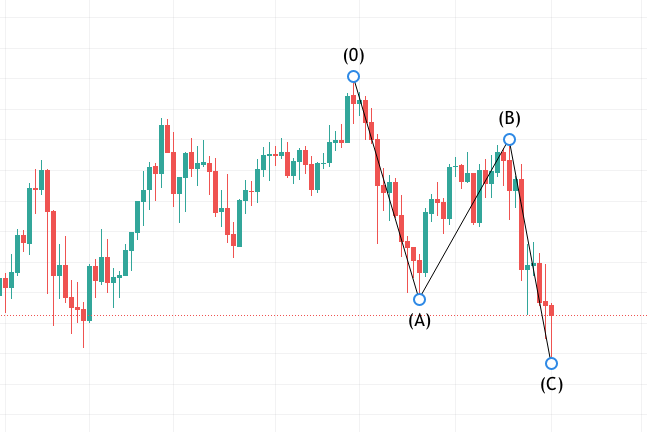
This is one of the reasons why we do not go in all measures at once. Very often, the correction is carried out on the basis of:
decline > consolidation > decline
In a consolidation we enter with 50% of the capital, so if the price drops, we can buy more. However, we also do not want to end up in a situation where we do not enter at all, hoping that after consolidation the price will fall more.
It may happen that the market will deceive us and start to rise immediately, but without us on board and we will have to wait another few weeks for the next correction.
Remember, it is better to always have an action plan and not rely on: “maybe things will work out the way I want them to.”
Divergence
The divergence will help us determine whether the increases in a given asset are slowly coming to an end.
For this we will use an indicator called MACD.
To add it to the chart, click on: Indicators > (enter: “MACD”) > select the first item:

You can zoom in on both the price chart and the MACD chart by holding the bar on the right side of the chart and sliding it upwards:
You can also grab the bar at the bottom and move the mouse left/right.
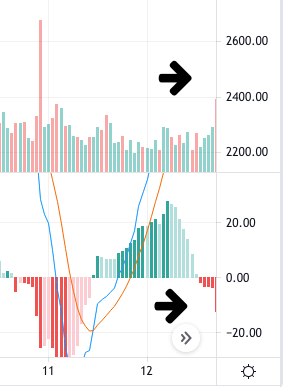
In short, the MACD shows the “momentum” of an asset.
If the price rises and the MACD begins to fall, it could mean that the power of buyers is declining and there may be a correction at any moment.
Below is an example of what exactly what I am talking about:

If such a situation arises, we are talking about a divergence, often followed by a correction.
The greater the interval we use, the greater the correction may be.
If the divergence occurs on a one-day interval, it may herald a greater decrease than in the case of a 4-hour or 1-hour interval.
This indicator may also suggest the end of the correction. In this case, the price goes down and the MACD goes up like in the screenshot below:

BTC inflow/outflow on cryptocurrency exchanges
In detecting upcoming declines, information on BTC’s inflow on cryptocurrency exchanges can also help us.
It is very easy to conclude that BTC is sent to the cryptocurrency exchange to be sold there.
On the other hand, if it outflows from exchanges, it means that someone has made a purchase and is sending BTC from the exchange to their external wallet.
If we subtract the sum of all BTC inflowed to the cryptocurrency exchange from the sum of all outflowed BTC, we will get information whether more BTC is flowing in or out to the exchanges in a given period.
If more BTC flows out, the price will likely continue to rise.
If more BTC flows in, the price may start to fall shortly.
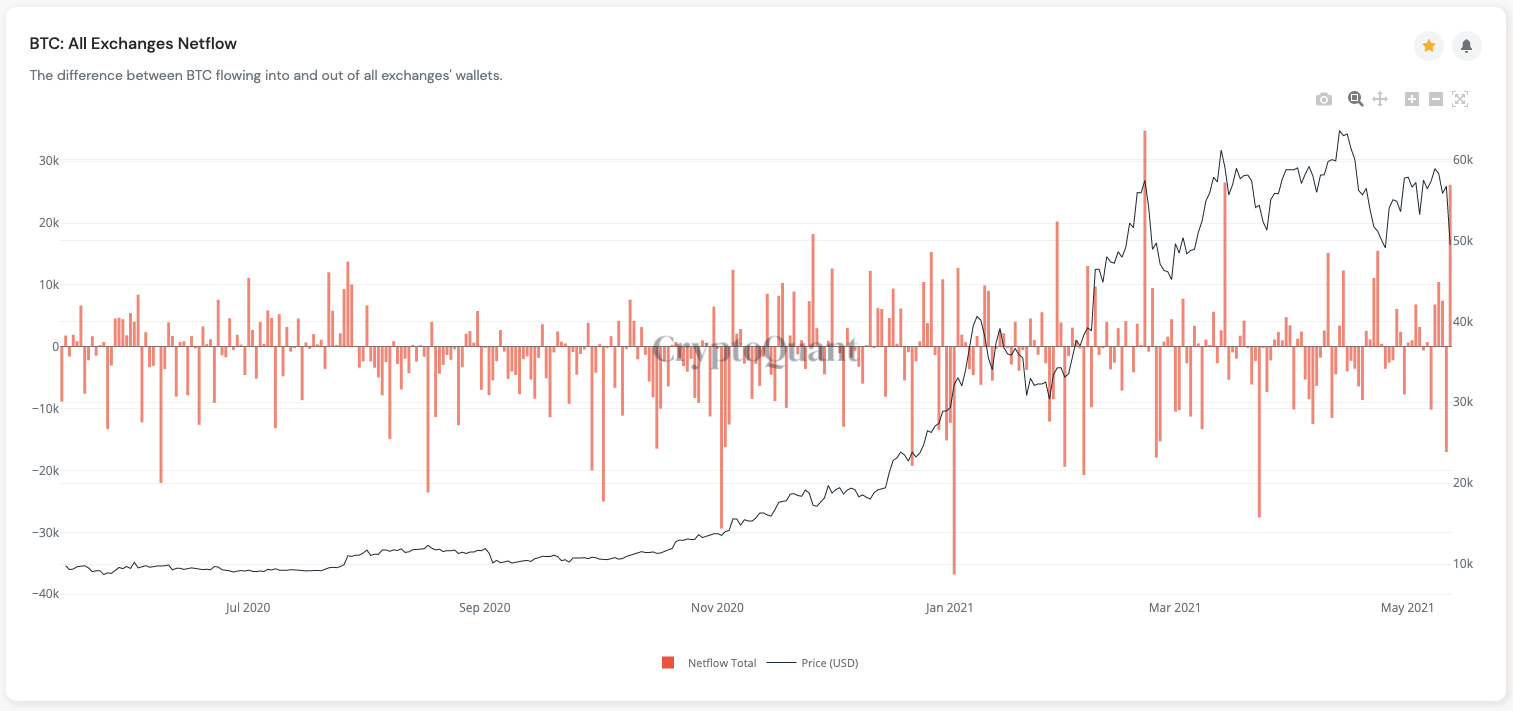
This data can be found on the free website: https://cryptoquant.com/overview/full/474?window=day
The higher the bar above the 0 line, the greater the influence on the cryptocurrency exchange at a given time.
In order not to have to look at this tool every now and then, you can set up a notification about large BTC inflows on exchanges and have it sent on Telegram or Mail.
After creating an account, here you can configure where notifications are to be sent: https://cryptoquant.com/profile/alert-settings.
Then we open: https://cryptoquant.com/overview/full/474?window=day and click on the “bell” in the upper right corner of the chart.
Configure the notification as shown in the screenshot below:
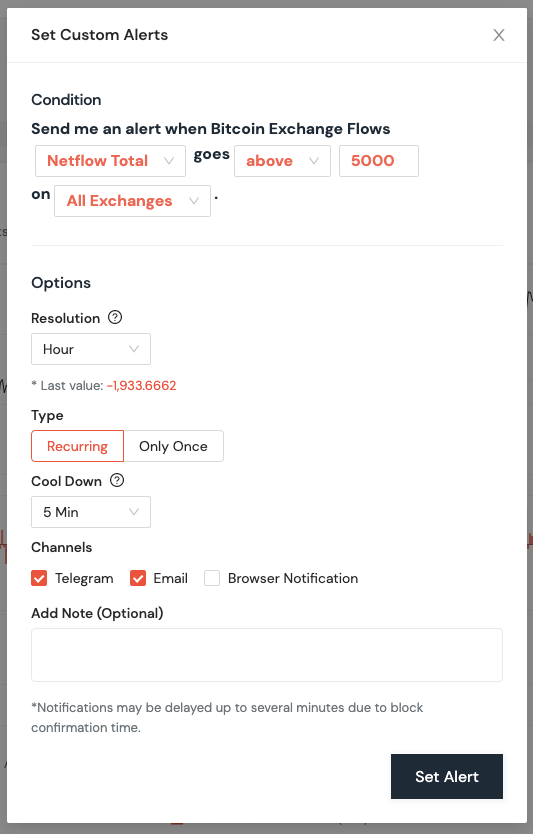
This way you will be notified by Telegram and/or Mail if 5000 more BTC has inflowed the exchanges in the last hour than it has flowed out.
As I mentioned, this will usually mean that BTC will be sold and therefore the price will drop.
As always, I remind you not to sell everything in panic!
If you can sense the moment and you are at your computer, you can sell a few per cent of your BTC and altcoins. However, if you see that the price has already dropped a lot, then better hold off.
Remember that you are selling to buy back after adjustment, not to sell at a fall in price and buy back… well, when? ????
Inflow of USDC on cryptocurrency exchanges
As you remember USDC is the so-called stablecoin, that is:
1 USDC = $1
USDC is a cryptocurrency, so you can also keep it on external wallets.
If you see a large amount of USDC flowing into the cryptocurrency exchanges, then people want to make an investment at this point.
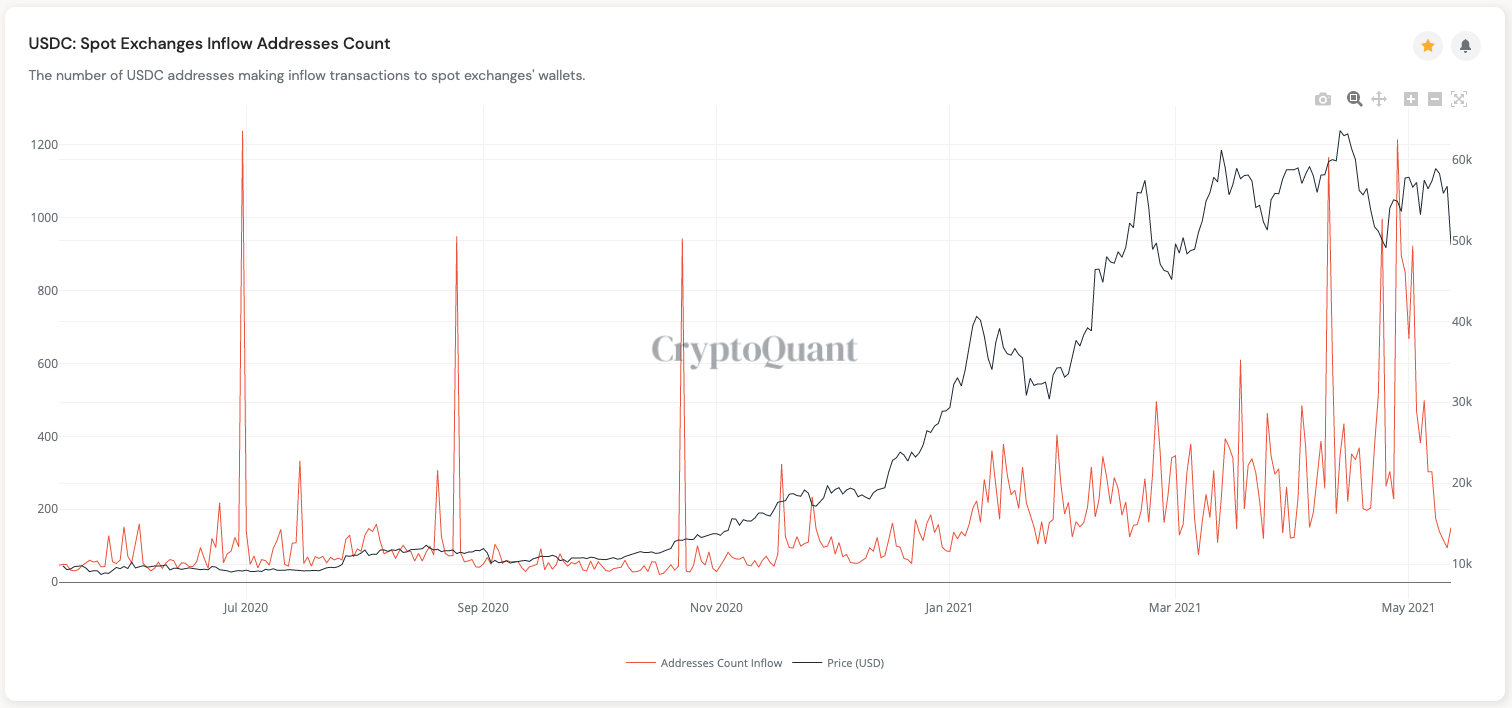
You can find this chart here: https://cryptoquant.com/overview/full/6543?window=day
When BTC flows into the cryptocurrency exchanges, it means that people want to sell it, so its price may drop down soon.
In turn, if USDC flows into the cryptocurrency exchanges, it means that investors want to buy cryptocurrencies with them, so we should expect price increases.
It’s also worth following this profile on Twitter: https://twitter.com/glassnodealerts
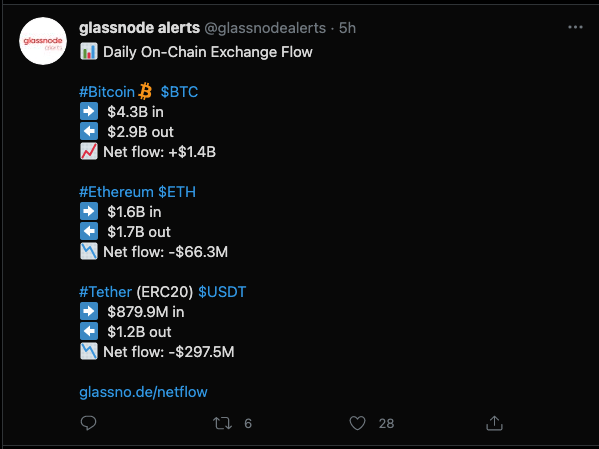
From time to time, information is provided there on how much BTC and USDT flows into the exchanges and how much flows out.
The USDT is also a 1 to 1 dollar stablecoin.
As you can see in the above screenshot. At the time when I was doing it, there was a large inflow of BTC to the stock exchange and a large outflow of USDT.
This means that many people were depositing BTC at this point to sell it and withdrawing the USDT they received from the sale.
This, of course, caused declines in BTC and all altcoins.
Behavior of investors who play on leverage
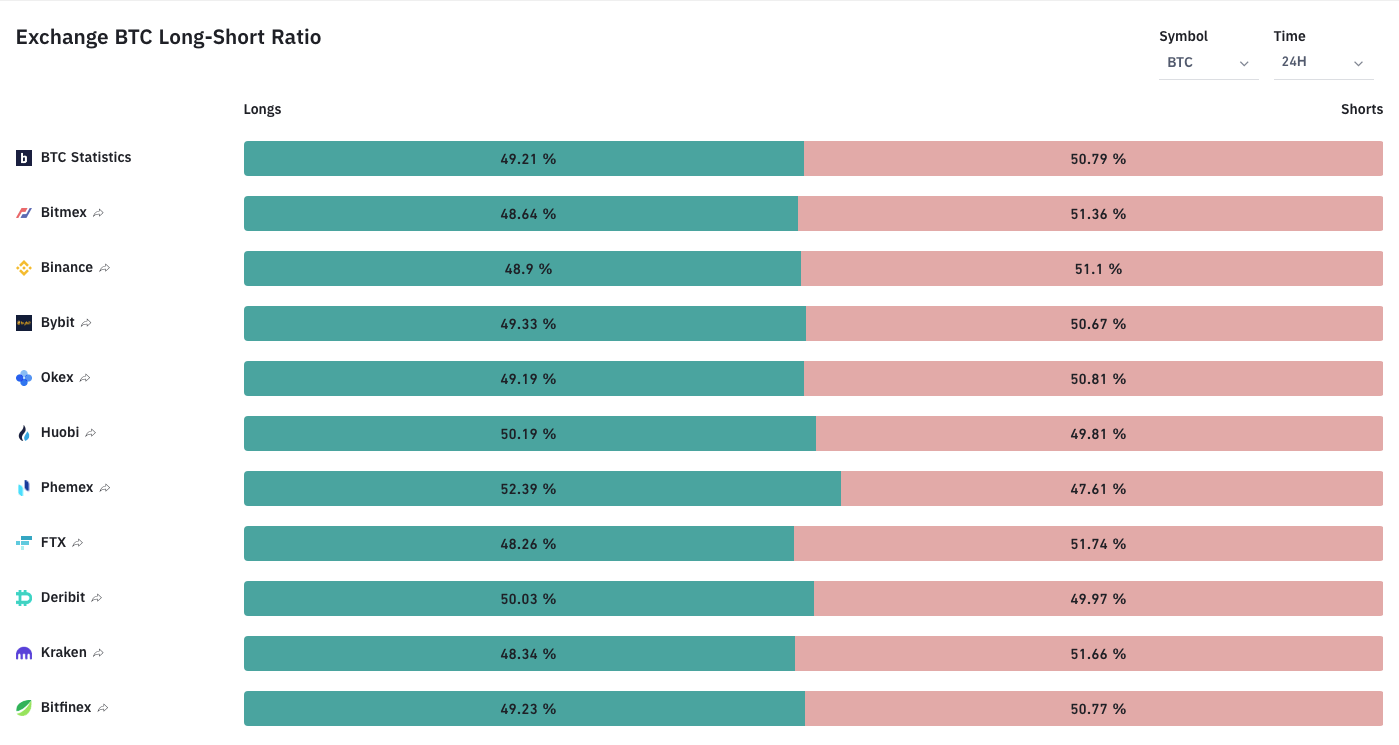
On the website: https://www.bybt.com/LongShortRatio you will find information on the percentage of investors currently playing for an increase and what percentage are playing for a decrease in the price of BTC.
In the top right corner you can set the time taken into account.
Playing the highs and lows with leverage is very risky and it is the traders’ business rather than the investors’.
Nevertheless, information on what decisions they make may prove to be useful for our puzzle, telling us when we can roughly expect a correction.
Behavior of miners
Generally, miners want the boom to last as long as possible. After all, since their business is based on Bitcoin mining, they want to eventually sell them at the highest possible price.
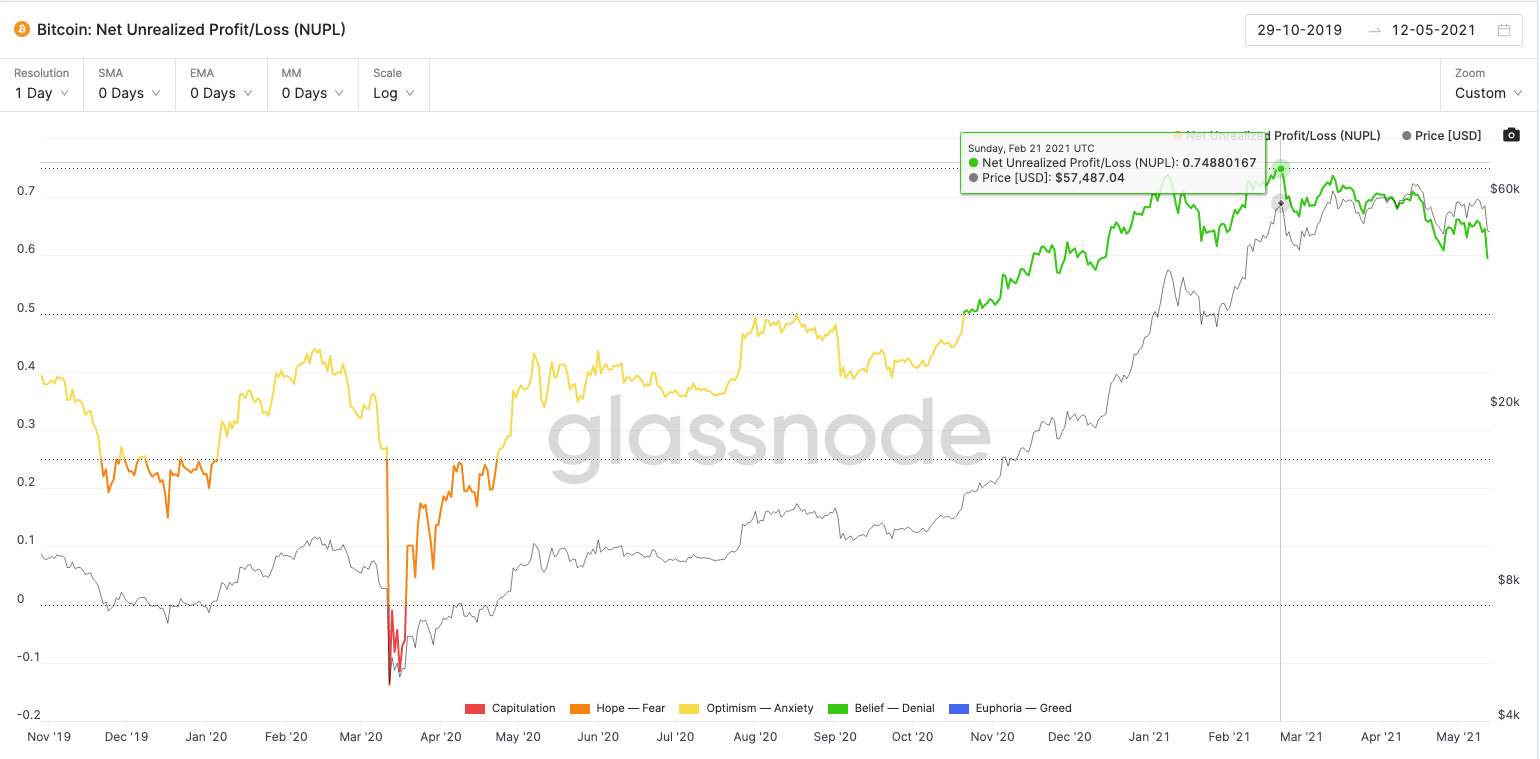
As you can see in the picture above, the NUPL indicator on February 21, 2021 almost crossed the dotted horizontal line.
As you already know, historically, entering euphoria levels has always meant the end of the bull market after a few days.
As a reminder, here is a free NUPL chart: https://www.lookintobitcoin.com/charts/relative-unrealized-profit–loss/
What did the miners do?
Knowing that if we enter the euphoria level, the bull market will most likely end (because it will cause panic) and we will never get to higher levels, so they decided to react.
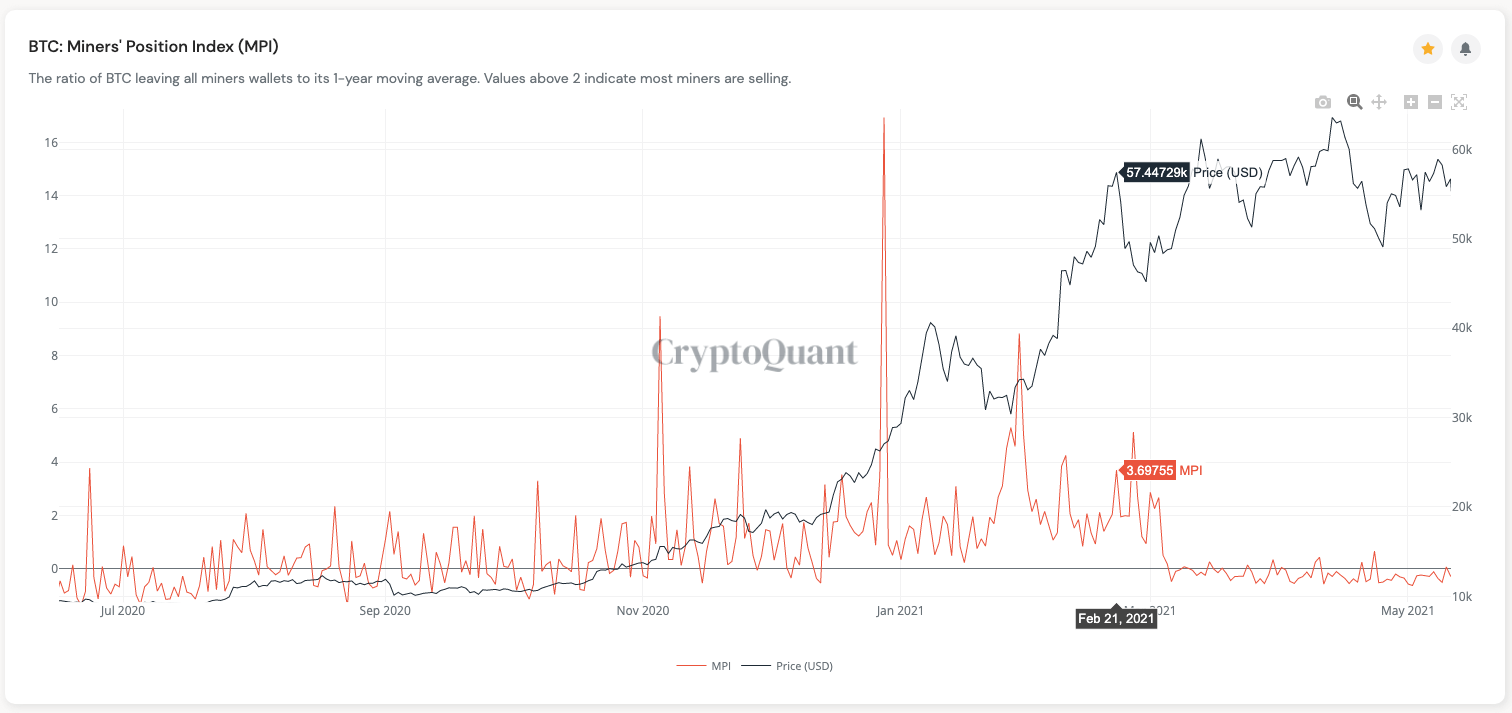
As you can see in the chart above, on the same day there was a huge inflow of BTC from miners’ wallets.
You can find the chart here: https://cryptoquant.com/overview/full/199?window=day
If the orange line goes above level 2, it means most miners are selling their Bitcoins.
As you can see, the miners, seeing the NUPL hit critical levels, started selling their BTC.
Thus, the price dropped, the NUPL index lowered its level and thus they managed to extend the duration of the bull market.
Currently (May 16, 2021), the chart shows that miners are accumulating their BTC and there are no significant outflows from their wallets. This clearly shows that the boom is not over yet.
Remember that miners, in order to mine their Bitcoins, have built huge halls filled with excavators that consume huge amounts of electricity. This is a business like any other for them, and they cannot afford for it to suddenly stop being profitable.
If miners were afraid of the end of the boom at this stage, they would start to get rid of their BTC to earn something and, above all, to cover the costs of electricity.
BTC transaction price
When you send your Bitcoins to another wallet, you are forced to pay a transaction fee in BTC.
The BTC transfer fees are not charged by the exchange. This is a prize for miners, and the very idea of charging is built into the Bitcoin code.
In simple terms, miners are busy connecting new blocks to the blockchain.
The idea behind a blockchain is that when BTC is sent from one wallet to another, we do not edit the existing data.
Instead, we create a completely new block in which the changes that have occurred are saved, for example:
From now on, George’s wallet contains 2 BTC less and Kasia’s wallet 2 BTC more.
Then this block is attached to the blockchain and that’s what the miners do.
However, in order to avoid a situation in which everyone who has a computer can connect whatever blocks they want, the proof of work mechanism has been created.
What is proof of work?
If everyone could add blocks with any information they want, there would be no one to check if the added block doesn’t carry out a transaction such as:
From now on, George’s wallet contains 2 BTC less and Jacob’s wallet 10 BTC more.
Something has to check that the data in the blocks makes sense.
Hence, Bitcoin has a built-in proof of work mechanism which says:
First, solve the puzzle, and then I’ll let you add this block.
When a puzzle is solved, the network checks that all transactions match and that there is no situation where someone is taking BTC from someone else without that person’s permission.
If everything is correct, this miner can add his block and in return gets rewarded:
- 6.25 BTC (after the next Halving, miners will only receive 3.125 BTC),
- The amount of BTC that results from the commission for all transactions in the block.
If there is something wrong with the transaction, the block is discarded and the miner gets nothing at all. Instead, he wasted a lot of power on unnecessary puzzle solving.
This makes it unprofitable for anyone to cheat.
You may be wondering how it is possible that a miner gets such a big reward for adding a block, since cryptocurrency excavators are not that expensive. Namely, people who mine Bitcoin with cryptocurrency miners for a few/several thousand dollars provide their computing power to the pool.
The pool is treated as one miner, and thanks to the computing power of thousands of computers connected to it, it very often manages to solve the puzzle.
After solving the puzzle, the reward is divided among all the connected devices in proportion to the computing power they have made available.
Mempools
This has nothing to do with the pools I have mentioned above.
You need to know that each added block does not contain just one but several thousand transactions.
Nevertheless, each block has a predetermined capacity and cannot contain all the transactions that have come to the network.
Therefore, the transactions of the people who have decided to donate the largest reward to the miners are selected first.
Thus, if you decided to give the miners too little commission during the boom, you might find that your trade could not be approved for weeks.
You would simply be pushed to the end of the queue all the time by trades offering a higher reward.
Fortunately, you don’t have to think about what commission to set for miners. This is done for you by each exchange/wallet application automatically. The reward is chosen so that your transaction goes through within minutes.
Transaction price monitoring
![]()
You can monitor the current transaction price on the free website: https://bitinfocharts.com/pl/comparison/bitcoin-transactionfees.html
On this chart, you can check whether it is worth transferring your BTC from the exchange to an external wallet like: https://shop.ledger.com/products/ledger-nano-x.
If the current transfer price is in the local low, it may be worth sending your cryptocurrencies to an external wallet at this point.
Mempool Size
You can also check out the “Mempool Size” chart, which tells you how many transfers are waiting in the queue at this point.
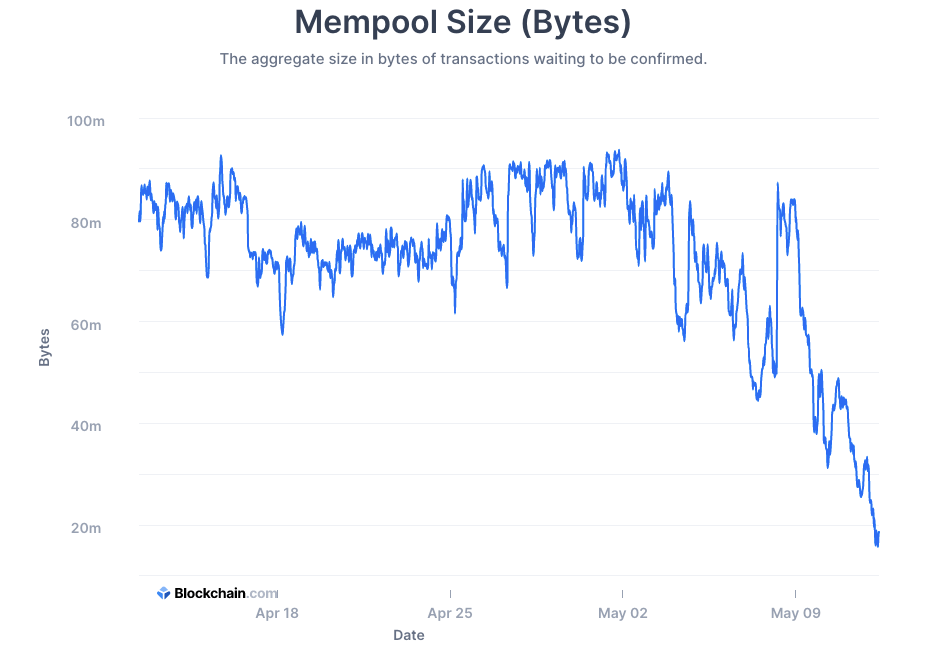
You can find the chart here: https://www.blockchain.com/charts/mempool-size.
The lower the chart is, the fewer pending trades and the lower the transfer fee.
The impact of the transaction fee on the bull market
You must be aware that the transaction feee is expressed in BTC.
On the other hand, the higher the price of 1 BTC, the naturally higher the transaction cost expressed in dollars, as shown in this chart:

In my opinion, however, we should not worry about the transaction price expressed in dollars but the one expressed in BTC.
You already know that the larger the queue in Mempool, the higher the transaction price. In turn, the larger the queue, the more people buy/sell their Bitcoins.
If throughout the entire boom we were able to reach the price at very high levels without any special crowding in the queue of transactions, and suddenly this queue increases dramatically, then we can begin to suspect that many long-term investors have begun to sell and hence the “crowd” is formed.
What was it like for the boom in 2017?
We can easily calculate what the transmission fee was in BTC right after the bubble burst in 2017.
- The commission in dollars as of December 21, 2017 was $54.90.
- In turn, 1 BTC cost about $16,000 that day.
So the transaction fee was then: $54.90 / $16,000 = 0.0034 BTC
In turn, on June 25, 2021 the fee for the transfer of Bitcoins (regardless of the quantity) was only 0.0002 BTC.
So about 17 times less: 0.0034 BTC / 0.0002 BTC = ~ 17
Since the cost of the transaction is dependent on the crowding in the “Mempool” queue, it is clear that at this point there aren’t many willing to sell their Bitcoins compared to the 2017 peak.
This clearly shows that we are still some way from the end of the bull market.
HODL Waves
This indicator allows you to determine how many short- and long-term investors are in the market.
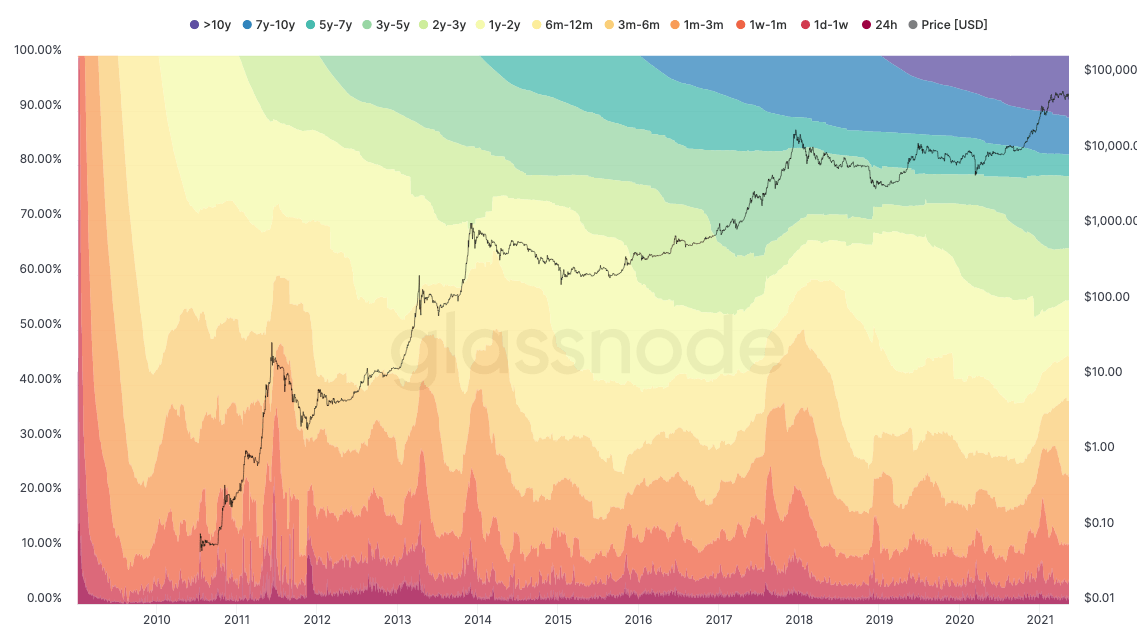
You can find this chart here: https://unchained-capital.com/hodlwaves/
If we hover over the right corner of the chart, we can see what percentage of BTC is held by investors who keep it in their portfolio for 24 hours to even 10 years.
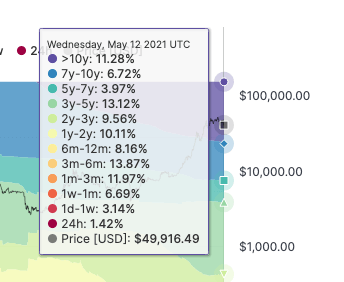
The percentage of people who have Bitcoin as of May 12, 2021:
- 7 to 30 days –> 6.69%
- from 1 to 7 days –> 3.14%
- from 24 hours –> 1.42%

However, at the peak of the boom in 2017, it looked like this:
- from 7 to 30 days –> 12.49%
- from 1 to 7 days –> 6.49%
- from 24hours –> 2.05%
As you can see at the end of the last boom, there were almost twice as many people who had just bought Bitcoin (often for the first time in their lives and not knowing the market) than we have today (May 13, 2021).
It is worth observing how these numbers change because as I have mentioned many times:
The biggest threat to the boom is too high a proportion of new investors compared to long-term investors.
It is also worth mentioning that the moment we see that there are a lot of new investors in the market and we are at the bottom, there is nothing wrong with that. After all, since these people bought low, they are probably more experienced investors.
In addition, the mere fact of buying after the correction means that we can rather expect increases, so even new people will have no reason to panic.
The real problem only occurs when we are at the top and we can see that new investors are taking over more and more of the market.
Distorted capitalization
Quite a few people wrongly claim that there is absolutely no possibility that the BTC price will reach $200,000 or $300,000.
This argument is the fact that the BTC capitalization is now almost $1 trillion ($1,000 billion) at this point (May 14, 2021). In turn, the price of 1 BTC is $50,000.
If this price were to rise to $300,000, capitalization would have to rise to as much as $8 trillion.
This is calculated as: $300,000/$50,000 = 8.
So the capitalization would have to be $1 trillion * 8 = $8 trillion.
Meanwhile, it is too much capital. All over the world, investors are unlikely to find an additional $7,000 billion to invest in BTC at this point. This is the equivalent of 14 Tesla companies (yes, the Tesla car makers) or the equivalent of more than 3 Apple companies.
But, please, remember that this market is so young that only 2% of the population has ever invested in cryptocurrencies.
But is such capital needed?
The truth is, market capitalization is an indicator that distorts reality.
Let’s recap how we calculate capitalization
This is the current price of 1 BTC multiplied by the amount of BTC in circulation.
At the moment (May 14, 2021), the price of one BTC is $50,746 and there are 18,709,793 BTC in circulation.
So capitalization is: $50,746 * 18,709,793 = $949,462,404,059.
Now let’s answer the question:
Has every BTC holder bought it for exactly $50,746?
Of course not.
A part of BTC is owned by its creator.
We don’t know whether the creator of BTC (Satoshi Nakamoto) is still alive.
Another part was lost because quite a few people made a mistake and sent BTC to a wallet address from which it can never be recovered.
There are plenty of people who have been holding BTC since the 2013 boom when Bitcoin cost $10–$1,000.
A lot of people have invested in Bitcoin this year but still for $30,000, not exactly the $50,746 that is taken into the capitalization calculation.
As you can see, capitalization doesn’t tell you how much money has been put into the market, but how much could be taken out if everyone sold their BTC at $50,746 at the same time.
Which of course is impossible, because if everyone started selling at once, the price would start falling and those who sold first would actually get $50,746 for 1 BTC, while the latter would get less than 1 cent.
However, we have an indicator called “Buy support”
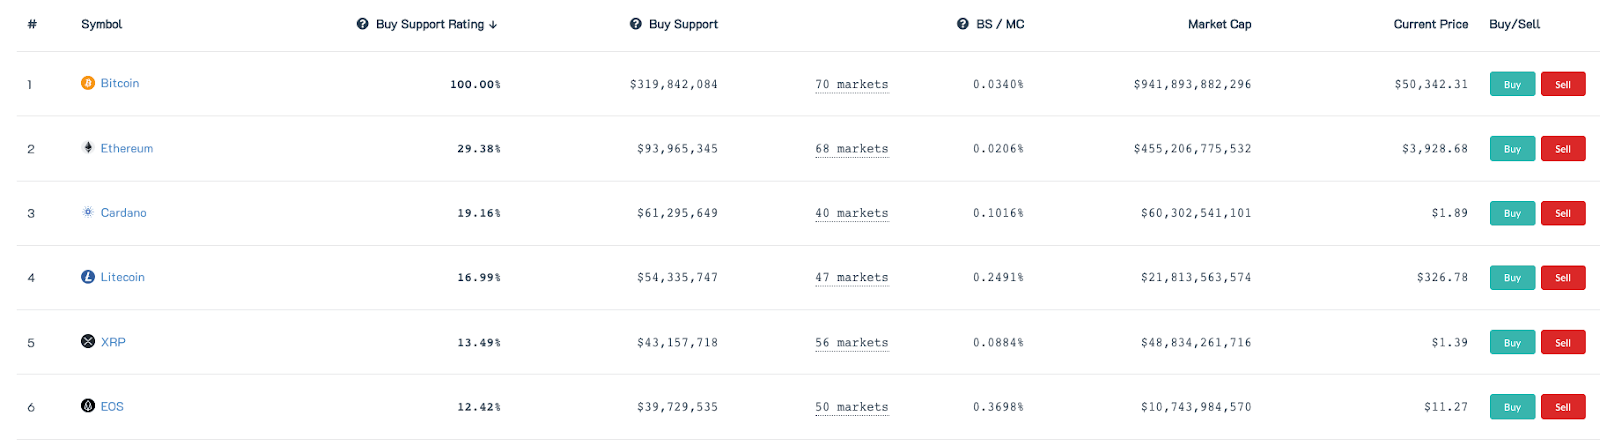
You will find this data on the free website: https://coinmarketbook.cc/.
You have to scroll down a bit.
Buy support tells you how much capital is needed for the price of 1 BTC to grow by 10%.
At the time of writing this article (May 14, 2021), to move BTC another 10% from a price of $50,441 to a price of $55,485, an additional $353,796,053 needs to be put into the market.
In turn, the capitalization would imply that you need to add as much as:
$94,946 240 405—so 268 times more!
10% of $949,462,404,059 is exactly $94,946,240,405.
One you’ve understood it, it becomes clear that this market (and thus the price of BTC) has very good prospects for the future.
An amount of $353,000,000 to move the price of BTC by as much as 10% is really not much.
One person, who does not even have to be on the list of the 100 richest people in the world, can invest that much.
We need to understand that the high price of BTC is not due to the fact that there is a lot of capital in it, but because its amount is limited.
What’s more, it is getting harder and harder to get it out.
If there were only $21,000,000 in the entire United States, and you couldn’t print more of those dollars, you would get $0.06 for every American.
Let’s assume that each family consists of 4 people and has an apartment and a car.
The wealth of one family is $0.06 * 4 people = $0.24.
Consequently, the apartment would be worth $0.23.
The car, on the other hand, would cost $0.01.
In fact, an apartment and a car would have to cost even less because money must also be in the pockets of Americans and in the form of everyday appliances, food, medicines, etc.
In my calculations, I assumed that everyone had just a house (unfurnished), a car, and nothing else. My point was just to show how a small supply (amount) of money in the market drastically affects its value.
Now think about it, there are only 18,709,793 BTCs mined at this point, and they have to be shared not by one country of 328 million people like the US but by 7.6 billion people from all over the world.
Looking at things from this perspective, you could almost say that Bitcoin is currently very, very cheap.
A “super cycle” in the cryptocurrency market
As you know, due to the shutdown of economies around the world, most countries have decided to “help” people with money plucked out of the air.
Let’s take a look at what it looks like in the USA:
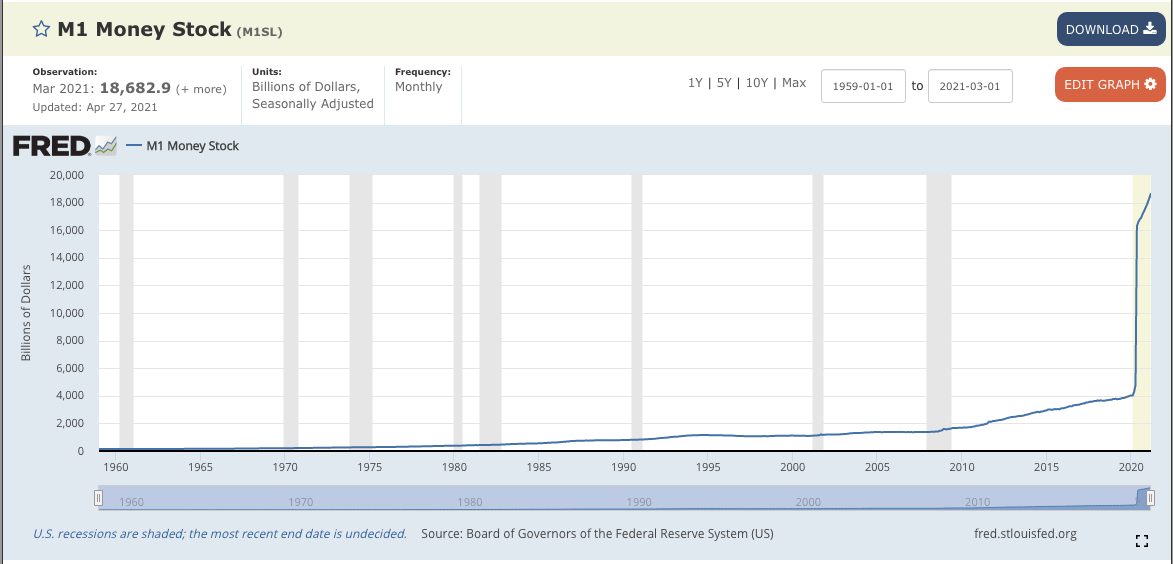
You can find the chart on the website: https://fred.stlouisfed.org/series/M1SL
If we hover over the chart, we see that the money supply in January 2010 was $1,674 billion.
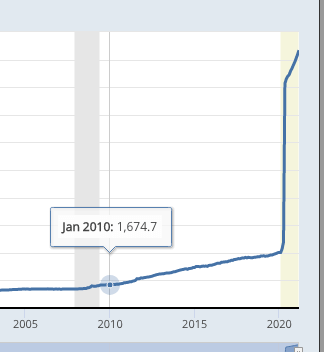
The money supply tells you how much readily convertible funds are currently in the hands of consumers. It is about funds that can be exchanged in a second for other goods—such as cash. The value of the car, apartment, TV, etc. is not taken into account here.
After 10 years, in January 2020, the supply of dollars increased to $4,018 billion.
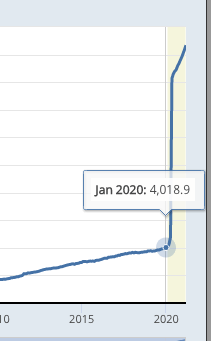
Thus, the supply increased 2.4 times in 10 years. Some will say that’s a lot, while others will say that’s a little. In any case, 10 years is some time though.
But wait, what’s happening now?!
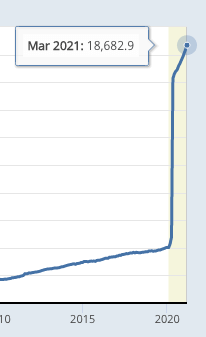
As you can see, from January 2020 to March 2021, the supply of dollars increased from $4,018 billion to $18,682 billion!
No, it’s not a mistake…
First, the supply of dollars increased 2.4 times in 10 years.
And now, in just 15 months, there was a 4.6-fold increase!
Let’s think when inflation occurs
If an entrepreneur notices that no one is interested in his services, he lowers the prices to reach more customers.
If most entrepreneurs do so, inflation goes down. So the prices go down.
On the other hand, if there are several dozen people lining up to see a particular entrepreneur, and he has so much work that he doesn’t know where to start first, he increases the prices of his services.
Why should he do something “cheap” when there are so many people waiting in the queue…
If most entrepreneurs do so, inflation will go up. So prices are rising.
As money is printed and given away for free (like in the US), it is obvious that more and more people will be “lining up” for traders and they, in turn, will raise the prices.
Why then has inflation not occurred after such a reprint?
For inflation to occur, money must circulate, that is, be spent. It is not enough for people to have a lot of money in their accounts. If they do not spend it, inflation will not occur.
As you already know, for inflation to rise, most entrepreneurs need “queues”.
What is the current circulation of money?
We have had a lockdown all over the world for the last 8 months
(I am writing this on May 15, 2021). It has been impossible to go to the cinema, restaurants, galleries, and for some time even to the hairdresser or a beautician.
As money is most often spent in these places, circulation has recently been very low.
People had more and more money, but were unable to spend it even if they wanted to.
Let’s take a look at the money circulation chart
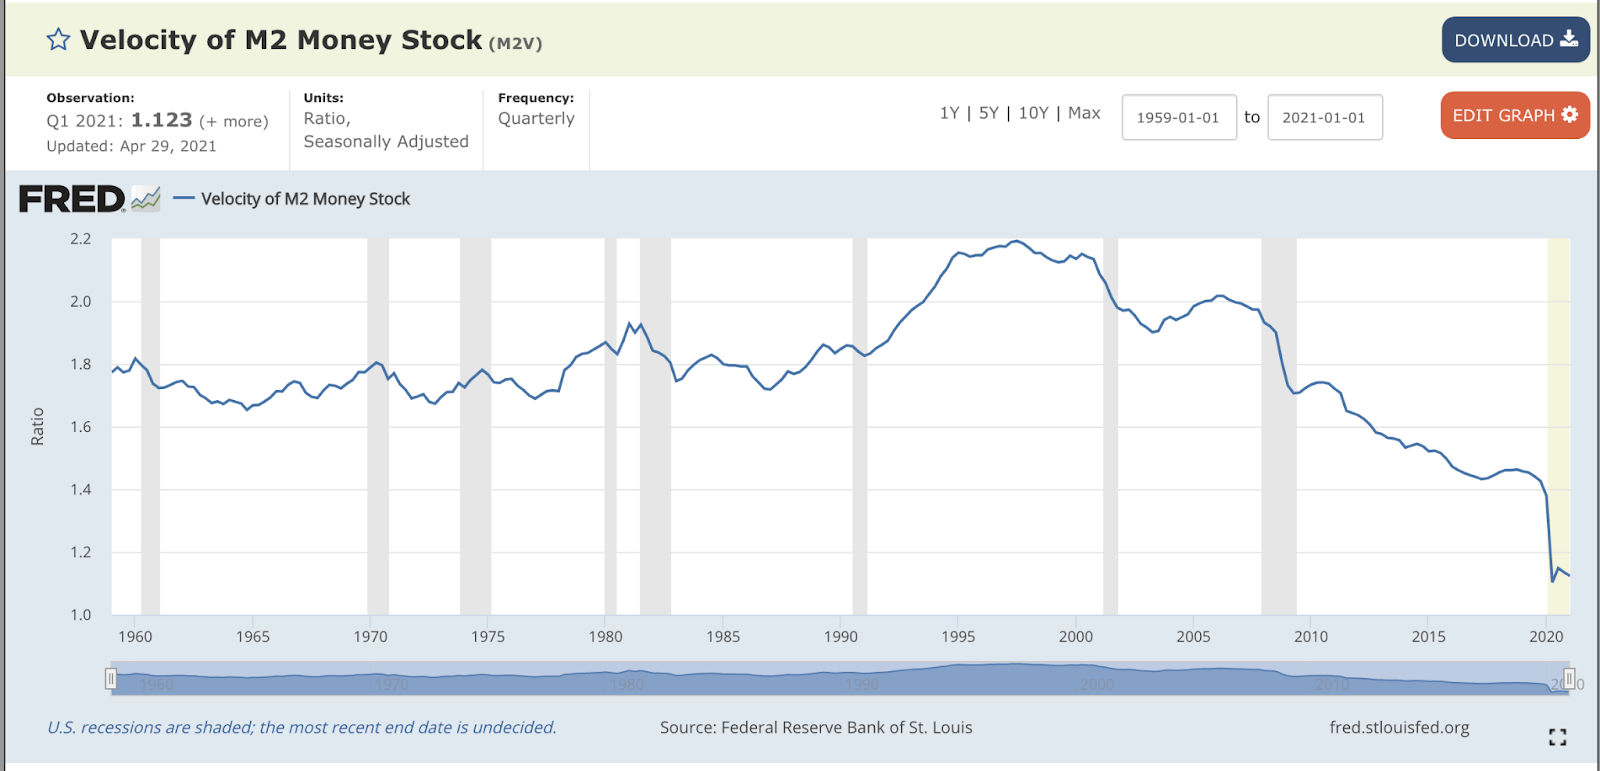
You can find the chart here: https://fred.stlouisfed.org/series/M2V
As you can see, reprint of money is at a record high level, while the circulation is at a record low.
In such an environment, inflation does not occur in most countries around the world.
Nevertheless, the restrictions are already being lifted, people will start spending too much money, circulation will increase, and inflation will shoot up any minute…
Interest rates
Interest rates tell you what the current interest rate is on an annual basis for funds borrowed from someone.
If you borrow $100 from someone and the interest rates are at 5%, then in a year you should legally give them back $105.
If interest rates are high, people keep money in bank deposits to earn money.
On the other hand, if interest rates are low, people will find that there is no point in saving. It’s better to just spend it.
Since we already know that inflation is rising only if two factors are present:
- too much money printing,
- high circulation of money,
then governments around the world, knowing they have printed so many billions plucked out of the air, should stop inflation by increasing interest rates.
After all, if a deposit at the bank yielded, say, 5%, many people would prefer to save than spend and inflation would not occur or be so severe.
What are governments around the world doing instead?
That’s right… They cut interest rates to record lows.
It’s getting to the point where most banks aren’t paying customers to freeze their money in deposits. Instead, banks are introducing a fee for keeping money with them!
Thus, governments, instead of stopping the circulation of money (knowing how much they have printed), make people spend even more.
After all, nobody of sound mind can rest easy if they know their money is worth less and less. It is better to spend it as soon as possible.
It appears that governments around the world are deliberately creating inflation. They probably want to devalue the national debt that they can never repay.
A lot of people wonder who these countries owe money to. Martians? ???? Namely, governments issue treasury bonds and people buy them at a certain interest. This is how governments borrow money from their citizens and it is the citizens they owe money to.
When the debt is devalued by inflation, the ones who will lose are those citizens who first lent the state $100,000 worth as much as a good car, and then the state will give them $100,000 worth as much as a two-week vacation in Egypt.
What does this have to do with Bitcoin?
As you know, Bitcoin has 4-year cycles. At the end of each cycle, there is a bear market and huge drops.
Nevertheless, taking into account what countries are doing around the world, investors are beginning to wonder whether there is going to be a so-called “Super cycle.”
The point is that under normal conditions, there is a decrease in BTC of around 83% during a bear market.
Of course, this decline does not happen overnight, but lasts for several months.
Meanwhile, in an environment of rising inflation, it may turn out that this decline will be extremely small, i.e., by 40–50%. Then the price may be in consolidation (stand still) for a while and still start to rise.
Much faster than the cyclicality of BTC would suggest.
People all over the world need to somehow protect themselves from inflation somehow, and Bitcoin is perfect for that.
After all, Bitcoin was created for this very purpose. Its quantity is limited in advance and it is getting more and more difficult to mine.
Therefore, we can adopt certain strategies
Suppose the “on chain” indicators point to the end of the bull market and there has been a large correction.
We obviously sold everything well in advance.
In a normal environment, we would only rebuy a few/several months later, when the BTC price is scraping the bottom (e.g., 83% from the peak).
However, when we notice that inflation is raging around the world, it may be worth getting 10–20% of your capital a little faster. For example, after the BTC price drops by 40–50%. If the decline continues, we can slowly buy more BTC and average the price.
We do this because, as I mentioned, it is very possible that due to inflation there will be a “Super Cycle” and the BTC price will start rising much faster than its built-in cyclicality would suggest.
A long-term solution
The second solution is to simply buy BTC for 10-20% of your capital (e.g., at the next correction) and then sending it to an external wallet such as: https://shop.ledger.com/products/ledger-nano-x/.
In this case, we focus on a strictly long-term investment. We are then not interested in “on chain” indicators and whether BTC rises or falls in the short term.
It is a good safeguard against the various situations that governments around the world are planning for us.
Of course, you should react normally with all the rest of the capital invested in cryptocurrencies; that is: sell on tops, buy after corrections and sell everything when the “on chain” data indicates.
Here we are talking about not touching only a certain amount of BTC that you have set aside for the long term.
By the way, I would like to remind you that if you had bought BTC at the very top in 2017, you would still have a 300% profit after 4 years.
Also take into account the fact that many people will think the same way and will also leave 10–20% of their capital in BTC for the long term, fearing inflation. This in itself could lead to smaller falls in a bear market and the possibility of a quicker upward bounce than has happened in the past.
Threats for Cryptocurrencies
As we know, governments are working intensively on CBDC (Central Bank Digital Currency). Once it is introduced classic cash will be completely eliminated.
If the world can only pay with the digital currency of central banks, they may outlaw the activity of cryptocurrency exchanges.
Cryptocurrencies themselves cannot be outlawed. They are decentralized and cannot be suddenly removed. They will exist until the end of the world.
If exchanges were banned, you practically could not legally sell your cryptocurrencies to receive a digital dollar or another currency.
However, you will still be able to exchange one cryptocurrency for another using decentralized exchanges.
I will describe how to use decentralized exchanges in my next article.
Cryptocurrencies as “store of value”
In China it is taken into consideration to introduce an expiration date for the digital juan. This means that if you don’t spend your funds by a certain date, they will disappear from your account.
If such a system were introduced worldwide, cryptocurrencies may be the only way to hold value. It may turn out that it is impossible to save the way we would like to.
But why do I need these cryptocurrencies if they cannot be exchanged for dollars or other currencies?
The development of blockchain technology may lead to a situation in which the world will create an alternative monetary system based on cryptocurrencies.
Stores where it is only possible to pay with cryptocurrencies may come into existence. There may be alternatives to Uber, where you can only pay with cryptocurrencies. Generally speaking, it is in human nature that if people are forbidden to do something, they will always find a way to do it.
Alcohol was forbidden in the USA, Al Capone came and started selling it. Cocaine and other drugs were banned, and Pablo Escobar came.
Governments know it
If cryptocurrencies were banned, there would be no way to require from people to share information about how much cryptocurrencies they have. Thus, it would be more difficult to track people operating outside the law.
Therefore, cryptocurrencies will be regulated rather than banned.
Another point is that those who rule the world may also want to have cryptocurrencies as security for themselves and their children.
There have been many cases in history when a king was dethroned. Even Steve Jobs was fired from Apple at one point, despite being the founder of the company.
No matter how much power someone has, they can always be deprived of their privileged position. If only CBDC currencies existed, all the money from such a person could be taken away with one click of the mouse.
Governments also need to safeguard themselves.
The role of banks
Recently, we have seen that more and more payment institutions are making it possible to buy cryptocurrencies through them.
Visa, PayPal, Morgan Stanley and many other financial institutions have entered this market.
It is because when digital currencies are introduced, banks will become redundant.
Everyone will have an account at the central bank.
As a result, banks are trying to get into the cryptocurrency market because they realize that soon it may be their only source of income.
It is quite possible that banks will take over the role of cryptocurrency exchanges.
Thus, it gives us a little more confidence that cryptocurrencies are unlikely to be banned.
The selection of altcoins
As you know, you can find the list of altcoins here: https://www.coingecko.com/pl.
After clicking on a given cryptocurrency and scrolling down below, you can find information on what problem is solved by a given cryptocurrency:

Please, keep in mind that some cryptocurrencies do not solve any problems at all.
Dogecoin (DOGE) is such an example, it has no use (not even economic like BTC), but is in TOP10 because it was promoted by Elon Musk.
It is a cryptocurrency where you can earn a lot, but lose even more. It is more like a gamble than investing.
It is definitely better to focus on projects that have real use.
At the top, you can check the official website of a particular cryptocurrency. You can find even more interesting information about it there.
![]()
It is also worth going to the tab Overview > Social:

and then click on the Twitter logo of the cryptocurrency and start following its profile.
By checking cryptocurrency profiles on Twitter, you can get a lot of information about what is happening in a given project.
You must know that many cryptocurrencies (even those from the very top) do not yet offer any special functionalities (e.g., Cardano—ADA). People invest in them because they like the concept of the project. At the same time, they believe that when the creators manage to achieve the intended goal, the value of a given cryptocurrency will increase significantly.
If you see information on Twitter or on the website of a particular cryptocurrency that there is going to be a significant update in a few weeks’ time, it is definitely worth paying attention to. The closer to the update, the more people will know about it, and thus the value of a given cryptocurrency will increase significantly.
However, remember that regardless of whether we are talking about the stock market or cryptocurrencies, there is a saying:
“Buy rumors, sell facts.”
I mention this because very often, before a given update is implemented, the valuation of a given cryptocurrency will increase so much that it becomes irrational.
Most people think this way:
“If the update hasn’t come out yet and the price is already going up, what will happen when it comes to this update?!”
The unfortunate truth is that once the “rumor” becomes a fact, there is a huge profit-taking instead of the expected gains. Eventually, the price was going up because everyone was waiting for this big event. However, when it happens, new investors stop coming (since it’s after the event anyway), and thus the sell-off begins.
Therefore, remember to try to go out with most of your capital not on the day of the event but the day before.
Below, I will show you a few ways to find cryptocurrencies with growth potential.
What is Grayscale doing?
Grayscale is an investment fund from the US, which at the moment (May 16, 2021) has about $44 billion in cryptocurrencies.
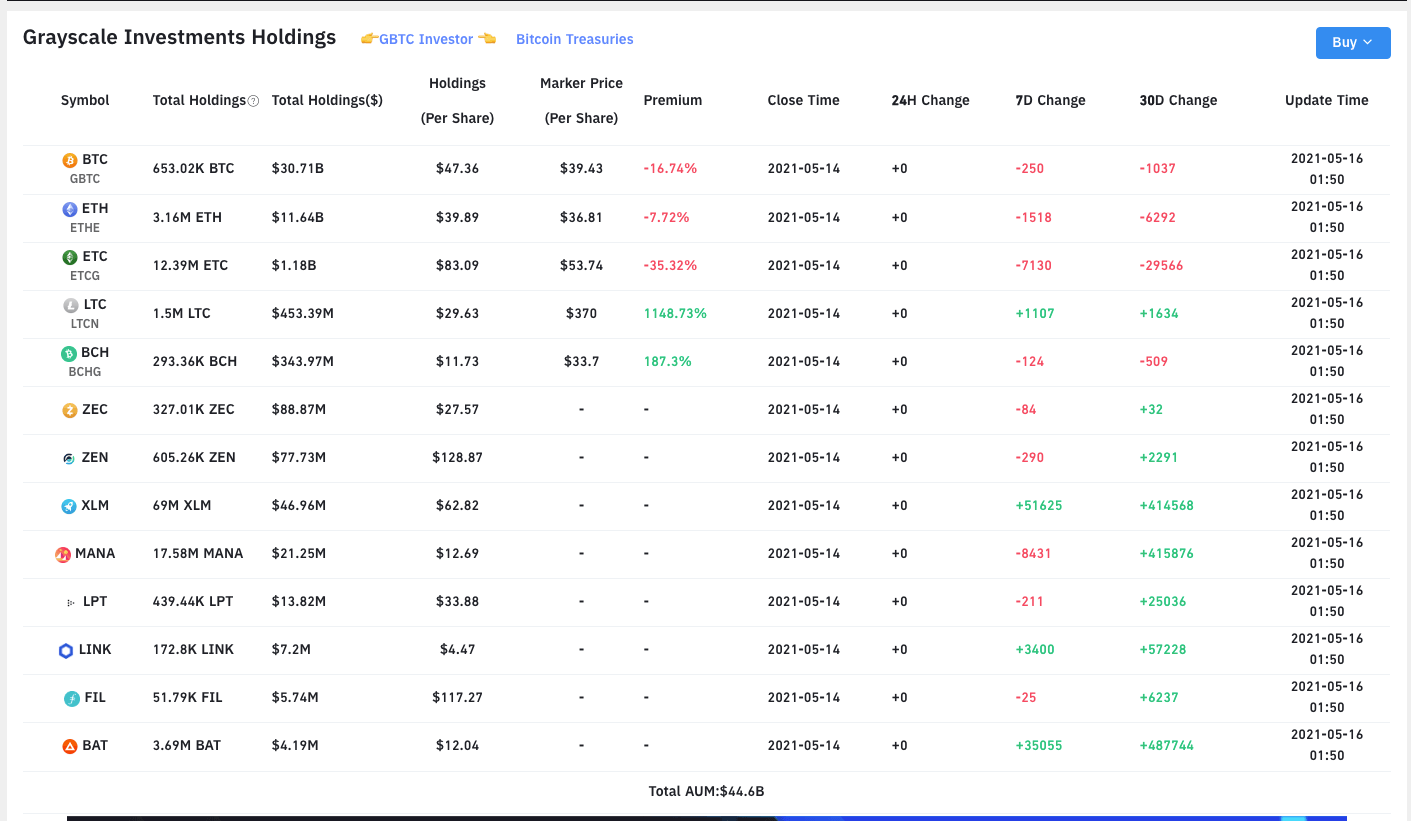
On this website: https://www.bybt.com/Grayscale you can see what cryptocurrencies they currently have in their wallet.
Grayscale Wallet is updated from Monday to Friday at the end of each day. Investment funds generally do not trade at weekends.
It is worth familiarizing yourself with what steps such a large fund is taking and perhaps think about investing in projects on their list that catch your eye.
Don’t pay too much attention to the fact that some are selling and others are buying.
They also make gradual profit-taking, play against events and so on. So keep in mind that if Grayscale sells a certain amount of a particular cryptocurrency, it doesn’t mean it’s bad and will be down, it just means they want to take out some of the profits.
What does Coinbase invest in?
Coinbase is the most widely used exchange in the US. Very often, large corporations such as Tesla invest in cryptocurrencies through it.
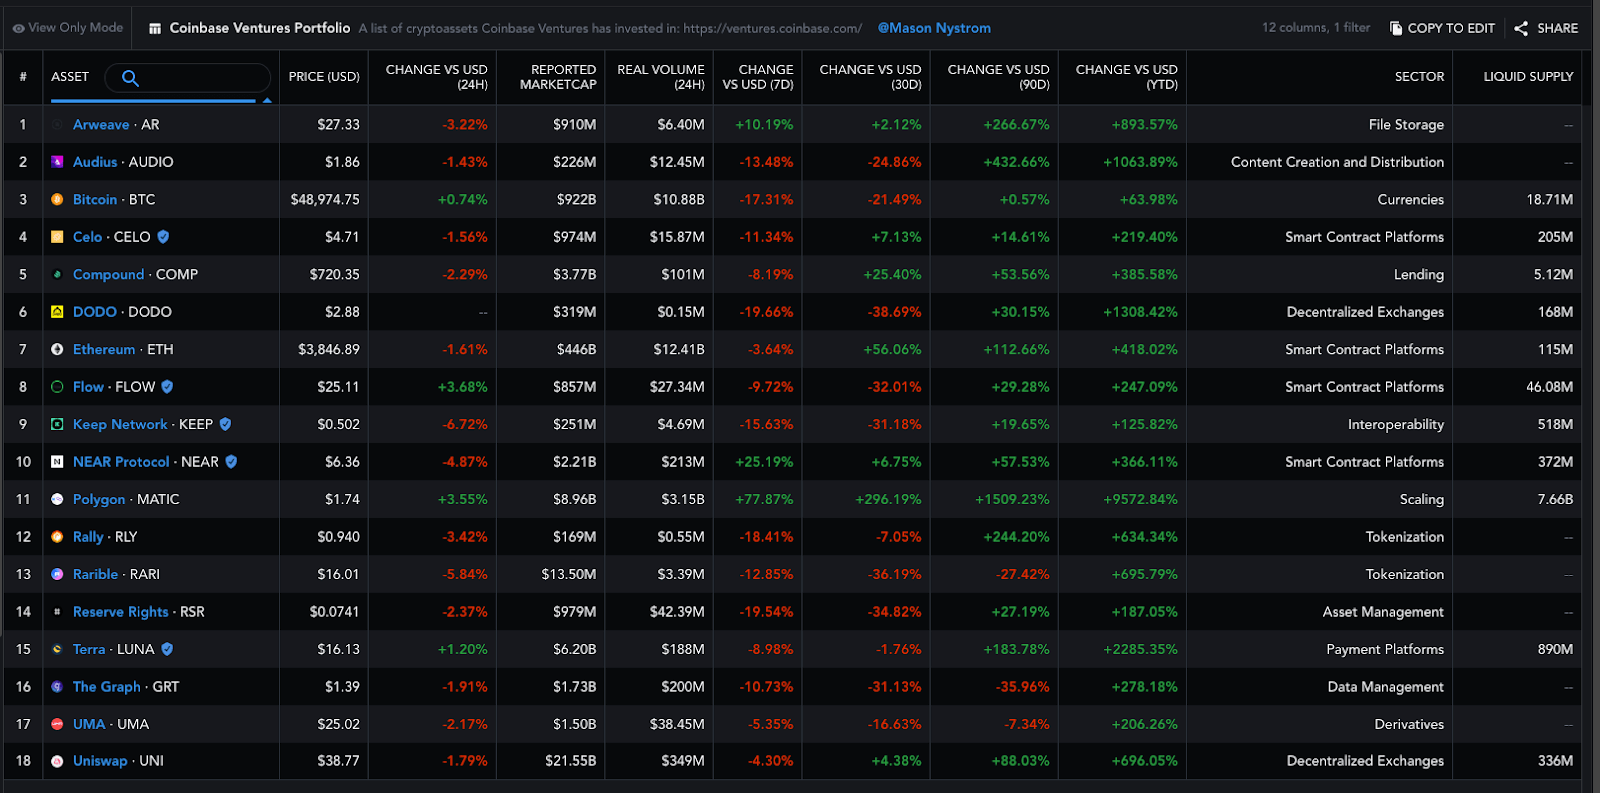
On the website: https://messari.io/screener/coinbase-ventures-portfolio-34D634C4 you can see what cryptocurrencies Coinbase is buying.
Coinbase has recently entered the US stock exchange. This makes many people who invest in classic stocks start watching Coinbase, including what cryptocurrencies they invest in.
Thus, more and more people and institutions will want to copy the actions of this stock exchange by investing in the same projects, so naturally their price will increase.
I encourage you to read about each of them.
Price to sales ratio
You must know that some cryptocurrencies are behind projects that earn commission for the provision of certain services.
An example is decentralized exchanges that earn commissions for exchanging cryptocurrencies with them.
However, in the case of centralized exchanges such as Binance or Coinbase, the entire commission is transferred to the exchange owner.
On the other hand, in the case of decentralized exchanges (or other services), the commission is often split among all the holders of a given cryptocurrency.
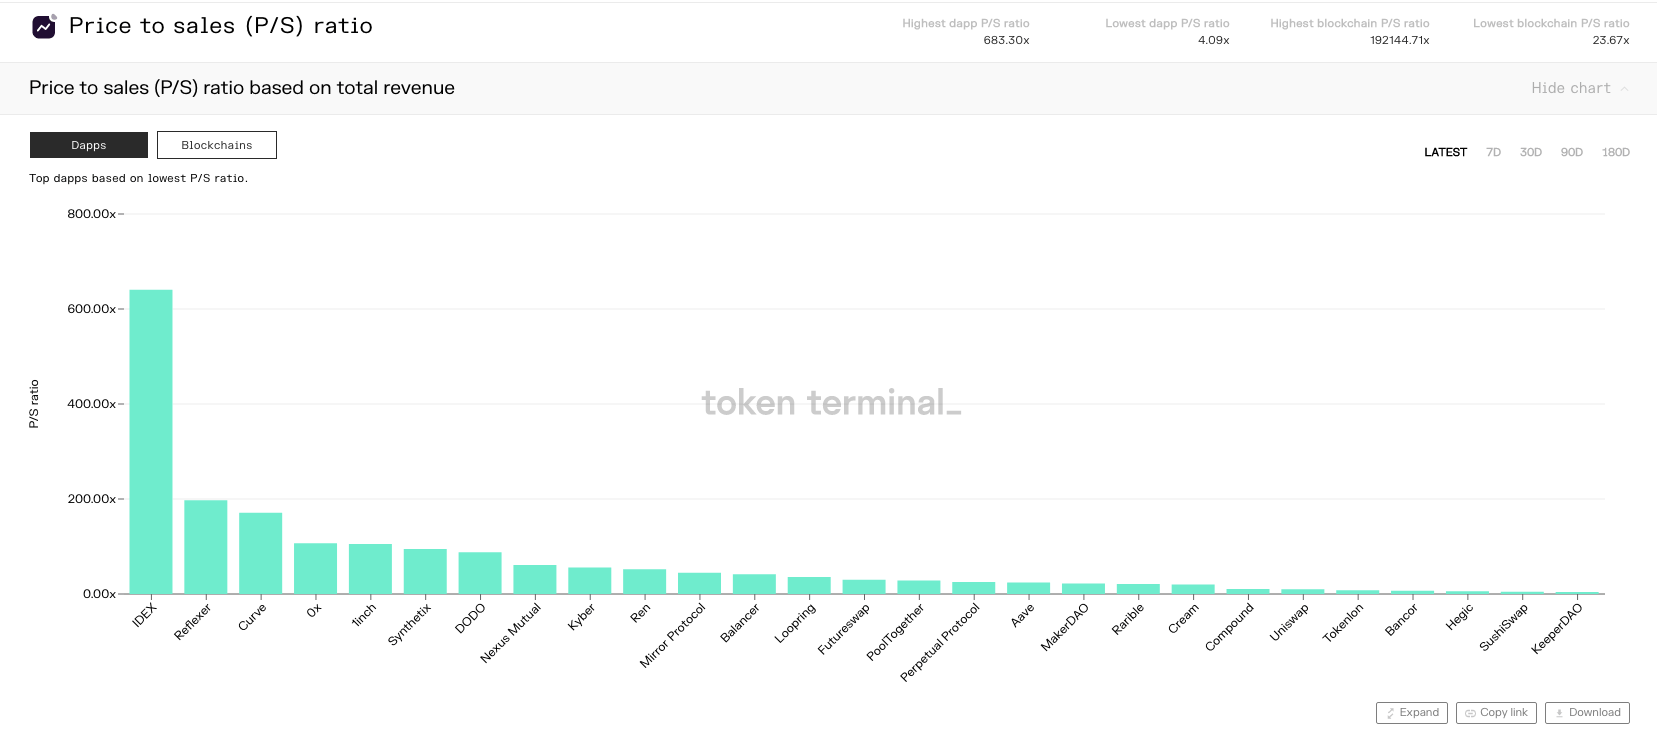
You will find this data on the website: https://www.tokenterminal.com/terminal/metrics/ps
On this website you will find information on how much profit there is for the holders of a particular cryptocurrency in relation to its price.
Let’s assume that a given cryptocurrency is owned by 100 people (each with 1 coin). The price per coin is $5. In turn, the profit (e.g., from commission for trading on the decentralized exchange) in a given period is: $200.
The profit has to be split among 100 holders, so: $200 / 100 people = $2 per person.
Therefore, someone pays $5 per coin to receive $2 per period. It seems fine.
So, P/S is calculated by dividing the cost of one coin by the profit per person: P/S = $5 / $2 = 2.5
If one coin cost $10 and the profit per person remained the same, someone would have to pay twice as much and get exactly the same in return.
In this case: P/S = $10 / $2 = 5
As you can see, the lower the P/S, the better.
The website https://www.tokenterminal.com/terminal/metrics/ps shows us which cryptocurrencies give high returns relative to their price. The closer to the right side, the better (the lower the P/S).
I will describe how this works in more detail in the next article. It is not enough just to buy a given cryptocurrency to earn passive profits.
Nevertheless, the lower the P/S of a given cryptocurrency (closer to the right), the more profit the service behind the cryptocurrency makes relative to its price. This clearly tells us that these projects have great potential for growth.
Summary
Using the above tools, I think that you can easily find 6 to 8 “gems” on the altcoin market that are worth investing in.
Where to get information?
Crypto panic
This website is a collection of the latest news from the cryptocurrency market updated on a regular basis.
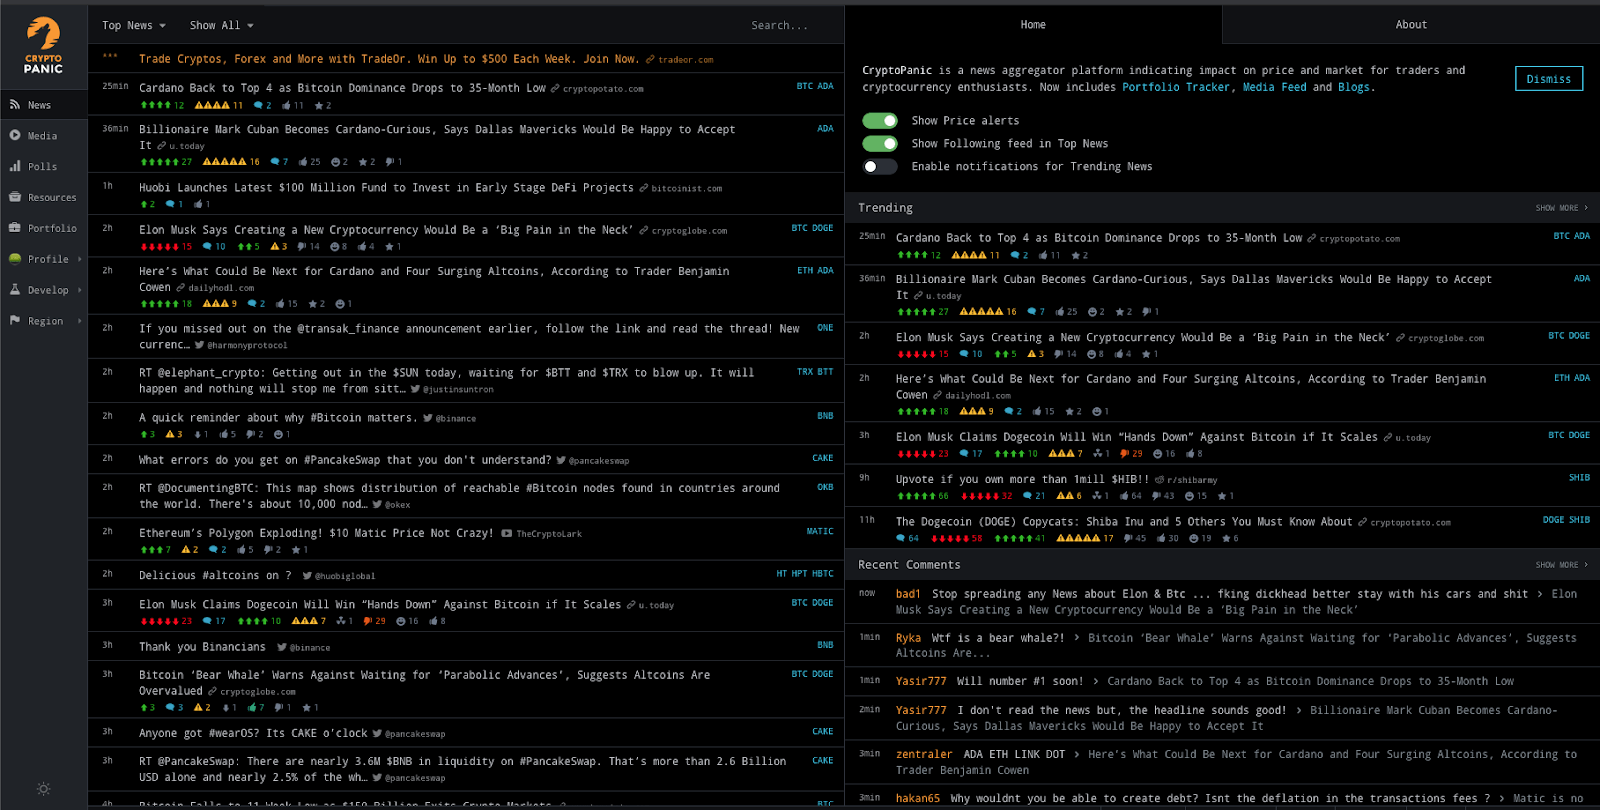
If a particular cryptocurrency starts to drop or if everything goes down, you can check what’s causing it on the website: https://cryptopanic.com/.
Sometimes there is no reason. Corrections occur regularly in this market for no reason whatsoever.
Of course, check such information only out of sheer curiosity to find out what could have triggered the drops. You should never sell in panic.
Messari
On this website: https://messari.io/research you will find weekly reports on the entire market but also interesting information on individual cryptocurrencies.
Summary
While the first (free) e-book allowed you to familiarize yourself with the cryptocurrency market and adopt a strategy, this one certainly made you much more aware of the entire market.
The more we know about the economy, the miners’ behavior, the more we realize how valuable Bitcoin is and how rare an asset it is, the better decisions we make.
The moment we are not informed investors and Elon Musk releases the news that Tesla is about to stop accepting payments in Bitcoin—WE PANIC!
Never mind that on-chain data shows that the boom is far from over. Never mind that governments around the world are deliberately driving inflation. Never mind that there is never going to be more than 21 million Bitcoins and it is getting harder and harder to get one.
Elon Musk has written a thing or two and you have to panic!
The moment we realize all of this, not only do we not make bad decisions driven by emotions, such as selling everything after drops, but we also make good decisions and at this low point we are not afraid to buy more.
Only the combination of the two will bring us a huge profit from this market.
What’s next?
The next e-book will probably be even more interesting than this one. In it, we will discuss DEFI or decentralized finance.
Even though the one you have just read is, in my opinion, the most important.
You can find the next e-book here: https://learncryptocenter.com/en/knowhow-p3-paid.
If you have any questions, feel free to ask in the comments below.
If you haven’t signed up for our newsletter yet, I strongly encourage you to do so.
That’s the only way to find out about new projects on this portal.
Thank you for your time!